Introduction.
Hopefully, you will find my viewpoints insightful and thought provoking. Often, my focus was on average exit velocity, with the idea if exit velocity is high then good results will follow.
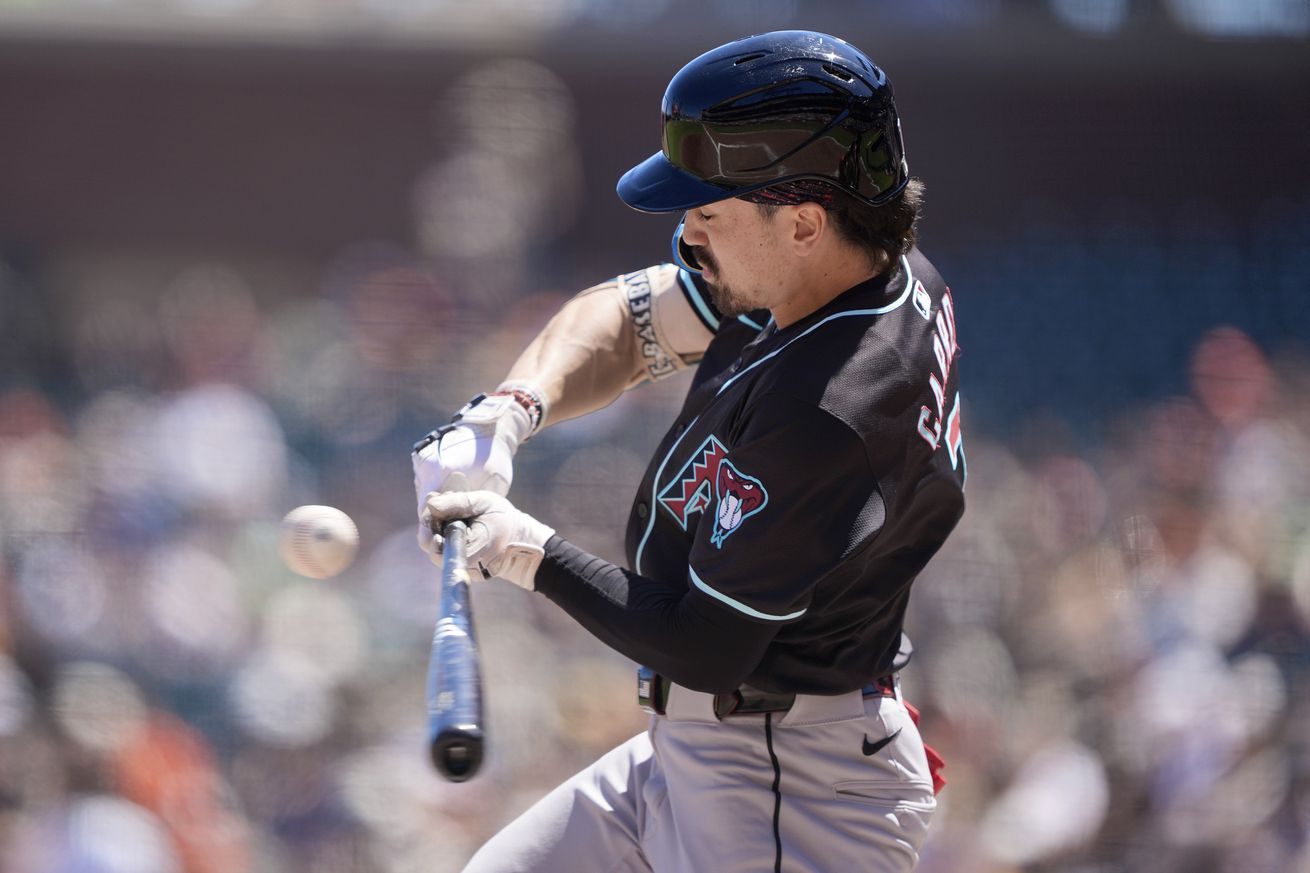
Corbin Carroll and Joc Pederson are two left-handed Diamondback batters. I sometimes compared their statistics with the intention of making Corbin Carroll’s statistics more meaningful.
While I was working on this article, Jim published an excellent article, “What’s the matter with Corbin Carroll?”
When I informed Jim McLennan a little bit about what I had found, he encouraged me to publish my stuff because “…there is room for more analysis.” Thanks Jim!
All pitches: Comparing 2024 to 2023.
This season through 25 April, Corbin Carroll’s average Exit Velocity (EV) fell from last season’s 88.3 MPH (which was near the league’s 88.5 MPH average) to 83.4 MPH (a five MPH drop).
Because his EV dropped, it makes sense that two performance measures dropped: OBP (.361 to .321) and SLG (.506 to .260).
Intuitively, it seemed he had trouble with inside pitches. After we review Baseball Savant’s zones, let’s look at inside pitches in general, and then let’s look at inside breaking balls.
Two Groups of Inside Pitches.
To view Baseball Savant’s attack zones: If you left click on attack zones at the Baseball Savant web site, you will see their attack zones, each labeled with a number.
Let’s look at two groups of inside pitches.
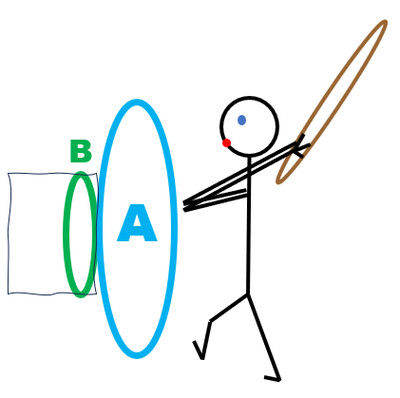
- Group A are inside pitches for a left-handed batter. Group A pitches are in attack zones 13, 16, 19, 23, 26, 29, 33, 36, and 39. They include pitches in the shadow, chase, and waste zones.
- Group B are pitches on the inside third of the heart of the strike zone for a left-handed batter. Group B pitches are in attack zones 3, 6, and 9.
The two groups of pitches are illustrated in my drawing that follows. This is what a fan would see from a premium seat behind home plate. You may have noticed that the stick person is bald (like me). It represents a generic left-handed batter, not any specific baseball player, alive or dead.
Inside Pitches in General.
Corbin Carroll’s average EV was lower than Joc Pederson’s for Group A pitches and Group B pitches.
- Corbin Carroll’s average EV for Group A pitches was 71.3 MPH. This average was much lower than his 83.4 MPH average for all pitches in all locations. Also, this average was much lower than Joc Pederson’s 85.8 MPH for Group A pitches.
- Corbin Carroll’s average EV for Group B pitches was 82.9 MPH, about the same as his 83.4 MPH average for all pitches in all locations. However, group B pitches are in the heart of the strike zone and Joc Pederson hit those pitches with an average EV of 101.7 MPH.
For readers who appreciate tables, the EV data is shown in the following table.
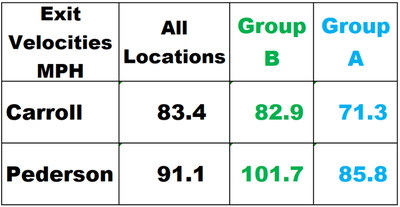
2024 Season through 25 April. Data from Baseball Savant.
Because his average EVs were lower compared to Joc Pederson, it made sense that Corbin Carroll’s had lower OBP and SLG for Group A and Group B pitches.
- Group A: .333 vs .700 OBP and .167 vs .250 SLG.
- Group B: .200 vs .667 OBP and .200 vs 2.000 SLG.
Inside Breaking Balls.
Let’s look at inside pitches that are breaking balls (basically curves, sliders, and sweepers). The complete list of breaking balls is on the Baseball Savant website.
- Group A. Of the 19 breaking balls in Group A (through 25 April) , Corbin Carroll did not put any in play, so no average EV. In contrast, Joc Pederson had an average EV of 98.1 MPH on breaking balls in Group A.
- Group B. Corbin Carroll’s average EV for breaking balls in Group B was 66.1 MPH. In contrast, Joc Pederson had an average EV of 104.6 MPH.
For another perspective, let’s look at Corbin Carroll’s at-bats on 27 April. Two pitches were inside breaking ball (sliders per MLB’s Gameday).
- One was in Group B (inside heart of plate) and Corbin Carroll took a called strike.
- The other was in Group A and Corbin Carroll took a swinging strike. Later in that at-bat, he put a fastball in play. It was in Group A and its’ EV was 62.5 MPH (softly hit).
A book had two insights.
To understand why (as a fan) I believe that Corbin Carroll can improve his EVs, I will share some thoughts from Rod Carew’s book, “Hit To Win.” The obvious caveat is that instead of reading my article, Corbin Carroll should be focused on what works for him with the expert guidance of the Diamondbacks’ coaches.
Inside Pitches. “When a ball is bearing down inside or in the middle of the plate, you want to commit your hands earlier than when the pitch is on the outside part of the plate…Now , at contact on the pitch inside, the barrel of your bat should be parallel with your hands. If you’re doing things really right, the barrel should be beyond home plate….The contact zone for hitting is always in front of home plate.” — Hit To Win by Rod Carew
Breaking Balls. “The key to hitting the curve is deciding where the ball is headed and being patient enough to let it get there….The longer you can keep your hands back, your head still, and your body in balance, the better, more consistent contact you’ll make.” — Hit to Win by Rod Carew
What about inside breaking balls? My view is that the batter could face two seemingly inconsistent tasks – commit his hands earlier and keep his hands back longer.
What about the mental battle between the batter and pitcher? Pages 100 to 103 of “Hit To Win” provided great insights about two at-bats that involved mental battles. The following sentence was the most meaningful to me.
“After eight years of battles [against that pitcher] I know what his ball does, how he likes to pitch me.”— Hit to Win by Rod Carew
My view is that knowing what each pitch does and how each pitcher likes to pitch is what gives the batter an advantage in the mental battle. For that reason, and because he is young at 23.7 years old, my view is that Corbin Carroll will improve during each successive at-bat against each specific pitcher. Furthermore, he will improve during the season and he will improve each successive season.
Summary.
This season through 25 April, Corbin Carroll’s average EV (all pitches) was lower than last season (and his OBP and SLG were lower).
His average EV against inside pitches was much lower than Joc Pederson.
This season, inside breaking balls resulted in few balls-in-play. Inside breaking balls over the heart of the plate showed a dramatic difference compared to Joc Pederson (66.1 MPH EV vs 104.6 MPH EV).
Two Insights:
- Hitting well against inside breaking balls might require the seemingly inconsistent tasks of committing your hands earlier and holding your hands back longer.
- As Corbin Carroll learns what each pitcher can do, and how each pitcher likes to pitch, I’m confident he will improve. That improvement will include batting against inside pitches and inside breaking balls.