
After 32 Games.
Inspiration.
The Diamondbacks’ runs scored per game fell from last season. Although 5.09 is ranked #6 (high), why was it less than last season’s 5.47 runs scored per game?
Recently, Ketel Marte returned from the Il. Was his absence felt? This article showed an early view. Now we can see more in-depth insights.
Background.
Last season, the Diamondbacks scored the most runs in the Majors.
- 1811 baserunners (two sigma more than the 21-23 average).
- High percentage (7.7%) of baserunners scored because of home runs (these runs exclude the batter).
- High percentage (27.3%) of baserunners scored because of non-homers.
For more details see this AZ Snake Pit article.
Scoring Baserunners.
This season the number of baserunners per game was 3% lower as last season’s extraordinary level. In the context that the Diamondbacks are doing well at getting runners on base, that 3% drop explains a drop of .17 runs scored per game. But this season’s drop was more than double that.
Baserunners who scored by home runs. In the first 32 games, the Diamondbacks scored more baserunners by homer compared to last season.
Baserunners who scored by non-homers. In the first 16 games, the Diamondbacks scored more baserunners by non-homer compared to last season. However, in the second 16 games they fell 5% short of matching the percentage from last season. That shortfall in scoring baserunners possibly explains half the drop in runs scored per game.
The following table shows baserunner details:
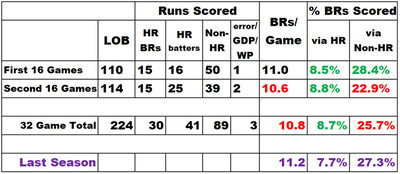
2025 Season, Diamondbacks. Data from Baseball Reference.
Batting With RISP.
The following table shows that the while the Diamondbacks’ batting ranked high with men on first base and no runners on base, they batted below league average with men in scoring position (RISP). Batting with RISP was a negative contributing factor.
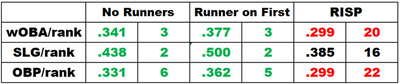
Games through 2 May, Diamondbacks. Data from Baseball Savant.
Batting with Runners on Base.
The following table shows that with runners on base (RISP and non-RISP) the Diamondbacks had more positive batting results (singles, doubles, triples, homers, walks and hit-by-pitches) in the second 16 games compared to the first 16 games. They improved from below league average to above league average. Batting with runners on base was a positive contributing factor.
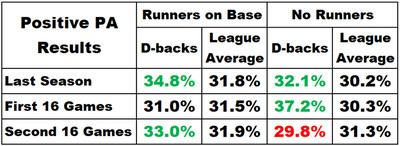
2025 Season, Diamondbacks. Data from Baseball Savant.
Extra Bases Taken.
A smaller contributing reason was that the Diamondbacks percentage of extra bases taken dropped from 55% after the first 16 games to 47% after 32 games. It’s a positive sign that 47% is significantly above the league average of 43%. Those extra bases taken contributed to a high percentage of baserunners who score. Data from Baseball Reference.
Ketel Marte.
At the risk of stating the obvious, when Marte was on the IL, when Marte was on the injured list, the percentage of baserunners scored was lower than last season (7.1% baserunners scored by homer and 24.8% baserunners scored by non-homer). I look forward to seeing whether his return increases the percentage of baserunners who score.
Summary.
The Diamondbacks’ runs scored per game fell from last season, but still ranks high.
- Baserunners per game was 3% lower than last season’s extraordinary level. In the context that the Diamondbacks are doing well at getting runners on base, that 3% drop was a negative contributing factor.
- While the Diamondbacks’ batting ranked high with men on first base and no runners on base, they batted below league average with men in scoring position (RISP). Batting with RISP was a negative contributing factor.
In the second 16 games, the following were significant.
- They fell 5% short of matching last season’s percentage of baserunners who scored by non-homer. That 5% shortfall was a negative contributing factor.
- Ketel Marte was on the jnjured list except the last game. His injury was a negative contributing factor.
- Their extra bases taken fell by 8%. While still above league average, it was less of a positive contributing factor.
- Their positive batting results with runners on base (RISP and non-RISP) improved from below league average to above league average. That improvement was a positive contributing factor.