For Each Pitch Type
Inspiration.
“Per Patrick Saunders of the Denver Post, Halvorsen threw a 103.3 mph pitch in the ninth inning, which is the fastest of the Statcast era, with data going back to 2015.” — Matt Postins, SB Nation
Data on the Baseball Savant website confirmed that on 3 July, his 4-seam fastball was 103.3 MPH. Victor Caratini hit that pitch for a fly ball single. His previous record (102.9 MPH) was on 17 May against Pavin Smith. Smith hit that pitch for a ground ball out.
Let’s look at the velocities of Diamondbacks pitchers.
Average velocities were different for each pitch type.
The following table shows the frequency and average velocity of pitches thrown.
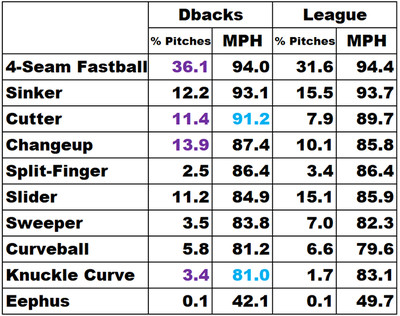
2025 Season through 3 July. Data from Baseball Savant.
Results were different for each pitch type.
The following table shows results for each type of pitch thron by the Diamondbacks.
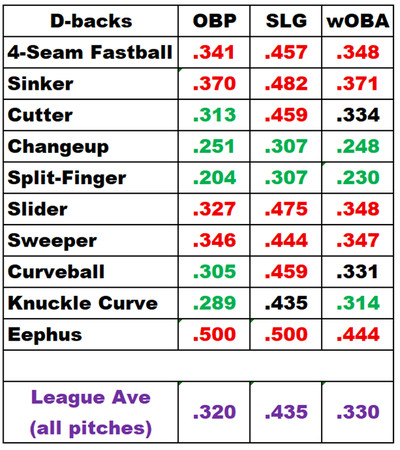
2025 Season thru 3 July. Data from Baseball Savant.
Of the three types of fastballs, the Diamondbacks pitchers go to the 4-seam and the cutter more often than league average. Their results were best with the cutter. Part of the reason may be their average velocity is higher than league average.
Although the knuckle curve is rare (1.7% of pitches) in the Majors, the Diamondbacks pitched it twice as often, with very good results. The average velocity was 2.1 MPH less than league average.
The types of pitches with the best results were the cutter, changeup, split finger, curve ball, and knuckle curve.
The fastest pitches were effective.
For each pitch type, the following table shows the fastest pitch thrown by a Diamondback. Also, it shows the results of each pitch.
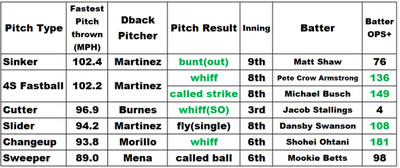
Diamondbacks, 2025 season thru 3 July. Data from Baseball Savant.
Interestingly, only one of these fastest pitches happened in the first five innings. Perhaps if that reflects a trend in all fast pitches, pitching fast pitches in the early innings is an opportunity to pitch better.
Justin Martinez was the pitcher with the fastest pitch for 4-seam fastballs, sinkers, and sliders. Burnes had the fastest cutter. His pitches with the fastest velocity were within one MPH of the fastest in the Statcast era. Cristian Mena had the fastest sweeper. Juan Morillo had the fastest changeup (not sure if that is noteworthy).
Most of these fastest pitches were against above average batters (including Shohei Ohtani!). Most of these pitches had a positive outcome (including three whiffs).
How do these fastest pitches compare to the fastest throws after fielding the ball? Among Diamondbacks fielders, Jordan Luplow (97.7 MPH) and Geraldo Perdomo (96.7 MPH) were fastest. In the Majors, Brandon Doyle (105.7 MPH) was fastest. This season, Oneil Cruz and Ronald Acuna Jr. each reached 104.9 MPH and may eventually break the record. Data from Baseball Savant.
The slowest pitches were effective.
For each pitch type, the following table shows the slowest pitch thrown by a Diamondback. Also, it shows the results of each pitch.
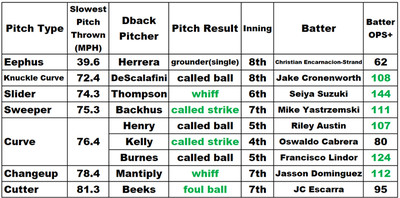
Diamondbacks. 2025 season thru 3 July. Data from Baseball Savant.
Interestingly, only one of these slowest pitches happened in the first four innings. Perhaps if that reflects a trend in all slow pitches, pitching slow pitches in the early innings is an opportunity to pitch better.
Catcher Herrera had the slowest Eephus, although it resulted in a single. There was a three way tie for the slowest curve.
Two thirds of these slowest pitches were against above-average batters. Most of these pitches had a positive outcome (including two whiffs).
Was there a difference between innings?
Because the fastest and slowest pitches rarely happened in the first 4 innings, I wondered whether there was a difference between the first four innings and the second four innings. After looking at pitch frequency and wOBA, three differences were found. They are shown in the following table.
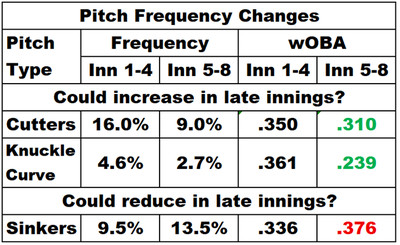
Diamondbacks. 2025 Season thru 3 July. Data from Baseball Savant.
It is possible that pitching results in innings 5-8 could be improved by increasing the frequency of cutters and knuckle curves, and by reducing the frequency of sinkers. However, other important factors are the capabilities of each pitcher, and the sequencing of pitches thrown to each batter.
Summary.
This season, among Diamondbacks pitchers, Justin Martinez pitched the fastest pitch (102.4 MPH sinker), and Herrrera pitched the slowest pitch (39.6 MPH Eephus). Justin Martinez was within 1 MPH of the fastest pitch in the Statcast era.
The fastest and slowest pitches were mostly against above average batters, and the results were mostly positive.
This season, of the three types of fastballs, the Diamondbacks had the best results from cutters, which averaged 1.5 MPH faster than league average.
Although the knuckle curve was rare (1.7% of pitches) in the Majors, the Diamondbacks pitched it twice as often, with very good results. The average velocity was 2.1 MPH less than league average.
Other types of pitches with good results were changeups, split fingers, and curveballs.
It is possible that pitching results in innings 1-4 could be improved by increasing the frequency of very fast and very slow pitches.
It is possible that pitching results in innings 5-8 could be improved by increasing the frequency of cutters and knuckle curves, and by reducing the frequency of sinkers. However, other important factors are the capabilities of each pitcher, and the sequencing of pitches thrown to each batter.